Section 4.3 Curves
There are many ways to describe a curve. Consider the following descriptions:
- The unit circle;
- \(x^2+y^2=1\text{;}\)
- \(y=\sqrt{1-x^2}\text{;}\)
- \(r=1\text{;}\)
- \(x=\cos\phi\text{,}\) \(y=\sin\phi\text{;}\)
- \(\rr(\phi)=\cos\phi\,\xhat+\sin\phi\,\yhat\text{;}\)
all of which describe (pieces of) the same curve. Here are some more:
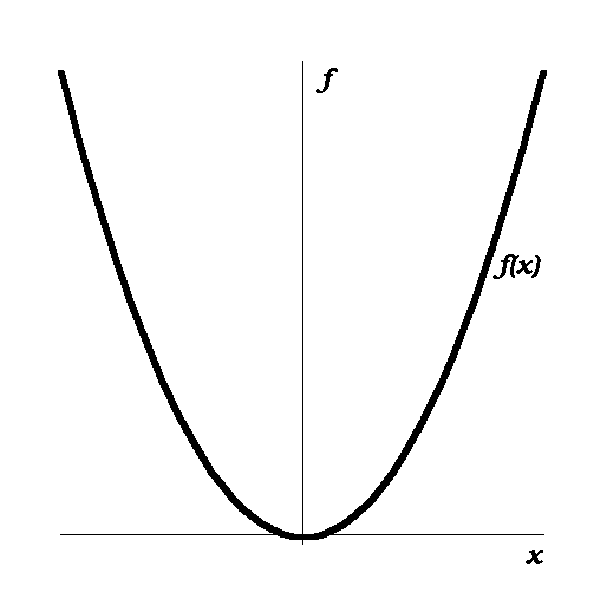
- The graph of \(y=x^2\text{;}\)
- The graph shown in Figure 4.3.1.
Which representation is best for a given problem depends on the circumstances.
